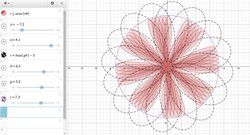
For my first piece of art I chose to use polar equations to make a flower. I used r is less than or equal to acos(n*theta) for the red part of the flower and added sliders for a and n. The less than or equals to sign shades the graph on the inside. The a slider determines how big the flower is and the n slider determines how many petals there are and the shape of them. For my black flower I used r=hsin(g*theta)-5 and added sliders for h and g. The h slider and the 5 make the flower the size it is. As the h gets smaller, the space in the middle gets smaller and it starts creating smaller petals in the middle and as the h gets bigger the space in the middle gets bigger. The g works the same as the n in the first equation. For the purple circle I used r=7.3. The 7.3 makes the circle the size it is.
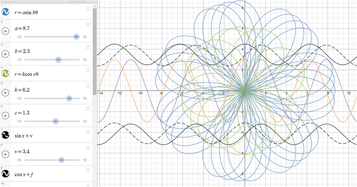
For this piece of art I used a combination of polar equations and sine and cosine equations. The first two equations were polar equations and I used r=asinb*theta and r=kcosc*theta and added sliders to both of them to make them the size and shape they are. For the black graphs I used sine and cosine equations but with different sliders so I could move them up and down and put them where I wanted them to be. For the purple graph I used sine and increased the amplitude. I did the same for the orange graph except I used cosine.
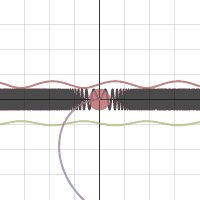
For my last piece of art I decided to make an animation and I used a mixture of random equations and added sliders. I used polar equations fort the flower and spiral and sine and cosine equations for the rest. For the black graph I used sinx^2(s) and added a slider for s. The slider determined how far apart the squiggles are from each other. For the green and red graphs (not the red flower) I used the square root and negative square root of sinx-k and added a slider for k. The negative square root flips it over the x-axis and the slider is what's moving the graphs up and down.
 RSS Feed