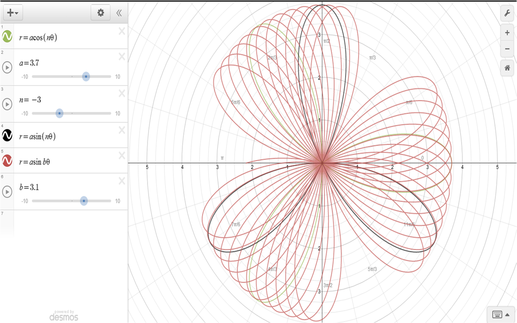
For this graph I used three different equations and added sliders to two of them to create flowers. For the first one I used r=acos(n*theta) which made the green flower that is hard to see. I added sliders for a and n. The a slider changes the size of the flower and the n slider changes the number and shape of the petals. For the black flower I used r=asin(n*theta) and because I already have sliders for a and n that flower moved along with the green flower. For the last flower, the red one, I used r=asinb*theta. I already had a slider for a so the size of the flower went along with the first two flowers but I was able to add a slider for b which changed the number of petals and the shape of them.
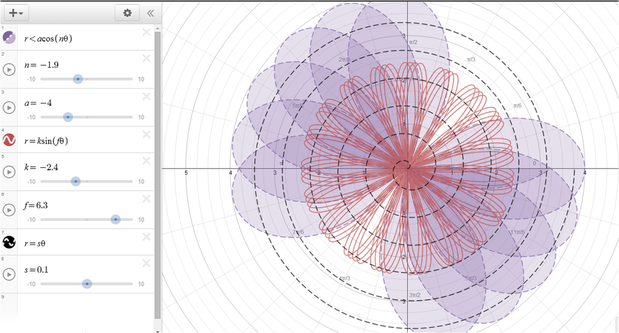
I used the same type of equations for this graph as I did for the first graph and I added sliders to these equations as well. For the spiral I used r=k*theta. The k slider changed what the spiral looked like and whether is started on the left side of the y-axis or the right. I was able to shade in the purple flower by using a less than or equal sign in the equation instead of an equal sign.
 RSS Feed